Tutorial
By default, following the tutorial will write any files to the current working directory.
Alternatively you can change the location the output files are saved to
by changing the arguments to the os.path.join calls.
When running the tutorial during test suite execution,
output files are written to a temporary directory created by pytest.
SkyModel
SkyModel is the primary user class, it can represent catalogs of point sources or diffuse models as HEALPix maps. A number of methods are available for reading in and writing out files as well as various transformations, including calculating fully polarized coherencies in the local Alt/Az basis (useful for visibility simulators). This tutorial should give a basic introduction to all the methods.
SkyModel: Reading in files and creating SkyModel objects
a) FHD
>>> import os
>>> from pyradiosky import SkyModel
>>> from pyradiosky.data import DATA_PATH
>>> sm = SkyModel()

>>> # Use the `read` method, optionally specify the file type. FHD default: expand_extended=True.
>>> filename = os.path.join(DATA_PATH, "fhd_catalog.sav")
>>> sm.read(filename)
>>> # If the file type is not properly recognized, set the `filetype` parameter
>>> sm.read(filename, filetype="fhd")

>>> # Use the `from_file` method to create SkyModel object without initalizing
>>> # an empty object, optionally specify the file type.
>>> # FHD default: expand_extended=True.
>>> sm = SkyModel.from_file(filename)
b) GLEAM
>>> import os
>>> from pyradiosky import SkyModel
>>> from pyradiosky.data import DATA_PATH
>>> sm = SkyModel()

>>> # Use the `read` method, optionally specify the file type. GLEAM defaults: spectral_type="subband", with_error=False.
>>> filename = os.path.join(DATA_PATH, "gleam_50srcs.vot")
>>> sm.read(filename)

>>> # Use the `from_file` method to create SkyModel object without initalizing
>>> # an empty object, optionally specify the file type.
>>> # GLEAM defaults: spectral_type="subband", with_error=False.
>>> sm = SkyModel.from_file(filename)
c) VOTable
>>> import os
>>> from pyradiosky import SkyModel
>>> from pyradiosky.data import DATA_PATH
>>> sm = SkyModel()

>>> # Use the `read` method, optionally specify the file type. VOTable required parameters: table_name, id_column,
>>> # lon_column, lat_column, and flux_columns.
>>> filename = os.path.join(DATA_PATH, "simple_test.vot")
>>> # The following are all functionally the same:
>>> sm.read(filename, table_name="VIII_1000_single", id_column="source_id",
...         lon_column="RAJ2000", lat_column="DEJ2000", frame="fk5", flux_columns="Si")

>>> # Use the `from_file` method to create SkyModel object without initalizing
>>> # an empty object, optionally specify the file type.
>>> # VOTable required parameters: table_name, id_column, lon_column, lat_column, and flux_columns.
>>> sm = SkyModel.from_file(filename, table_name="VIII_1000_single", id_column="source_id",
...                         lon_column="RAJ2000", lat_column="DEJ2000", frame="fk5", flux_columns="Si")
d) text
>>> import os
>>> from pyradiosky import SkyModel
>>> from pyradiosky.data import DATA_PATH
>>> sm = SkyModel()

>>> # Use the `read` method, optionally specify the file type. See API docs for required columns of text file.
>>> filename = os.path.join(DATA_PATH, "pointsource_catalog.txt")
>>> sm.read(filename)

>>> # Use the `from_file` method to create SkyModel object without initalizing
>>> # an empty object, optionally specify the file type.
>>> sm = SkyModel.from_file(filename)
e) skyh5
>>> import os
>>> from pyradiosky import SkyModel
>>> from pyradiosky.data import DATA_PATH
>>> sm = SkyModel()

>>> # Use the `read` method, optionally specify the file type.
>>> filename = os.path.join(DATA_PATH, "gsm_icrs.skyh5")
>>> sm.read(filename)

>>> # Use the `from_file` method to create SkyModel object without initalizing
>>> # an empty object, optionally specify the file type.
>>> sm = SkyModel.from_file(filename)
SkyModel: Plotting
a) using extended_model_group attribute
>>> import os
>>> import numpy as np
>>> import matplotlib.pyplot as plt
>>> from pyradiosky import SkyModel
>>> from pyradiosky.data import DATA_PATH
>>> sm = SkyModel()
>>> filename = os.path.join(DATA_PATH, "fhd_catalog_with_beam_values.sav")
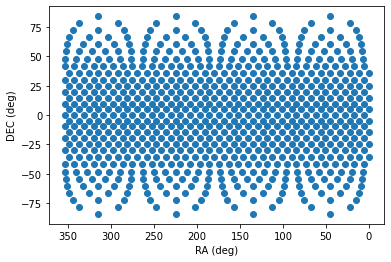
>>> sm.read_fhd_catalog(filename)
>>> plt.scatter(sm.ra, sm.dec)
>>> plt.xlabel("RA (deg)")
>>> plt.ylabel("DEC (deg)")
>>> # for RA to be in conventional order, use .value when integer required
>>> plt.xlim(max(sm.ra.value), min(sm.ra.value))
>>> # extends axis limits 5% beyond given limits
>>> plt.autoscale()
>>> plt.show()
>>> print(sm.Ncomponents)
4597
>>> print(sm.Nfreqs)
1
>>> print(sm.component_type)
point
>>> print(sm.spectral_type)
spectral_index
>>> # correction done since catalog reference frequencies had wrong power
>>> sm.reference_frequency = sm.reference_frequency*10**6
>>> print(np.unique(sm.reference_frequency))
[1.82435013e+08 2.15675003e+08] Hz
>>> print(np.unique(sm.spectral_index))
[-0.8]
>>> print(np.unique(sm.extended_model_group))
['32768' '32769' '32770']
>>> # beam amplitude for stokes parameter index = 0 (stokes I or unpolarized), Nfreqs index = 0 (first and only frequency
>>> # since Nfreqs = 1 for spectral index type), Ncomponents index = : (all components)
>>> print(np.unique(sm.beam_amp[0,0,:]))
[0.12874769 0.56623143 0.59106636]
>>> # Use `calc_frame_coherency` to calculate and optionally save it on the object
>>> # default is `store=True` which will save it on the object rather than returning it
>>> sm.calc_frame_coherency()
>>> # coherency (2 x 2 matrix of electric field correlation) for polarization1 index = 0 (North),
>>> # polarization2 index = 0 (North), Nfreqs index = 0 (first and only frequency since Nfreqs = 1 for
>>> # spectral index type), Ncomponents index = 0 (first component)
>>> print(sm.frame_coherency[0,0,0,0])
(8.400908470153809+0j) Jy
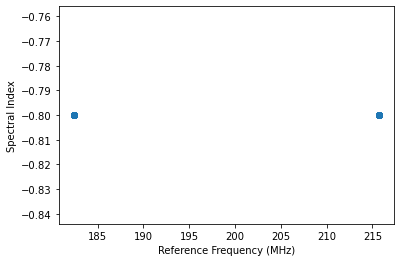
>>> # dividing by 10^6 since frequency typically plotted in units of MHz
>>> plt.scatter(sm.reference_frequency/10**6, sm.spectral_index)
>>> plt.xlabel("Reference Frequency (MHz)")
>>> plt.ylabel("Spectral Index")
>>> plt.show()
>>> index_32768 = []
>>> for j in range(len(sm.extended_model_group)):
... if sm.extended_model_group[j] == "32768":
... # indices for extended model group 32768
... index_32768.append(j)
>>> # confirming that there is one reference frequency for this extended model group
>>> print(np.unique(sm.reference_frequency[index_32768]))
[2.15675003e+08] Hz
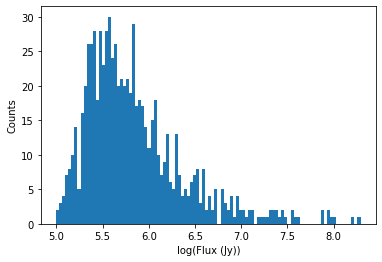
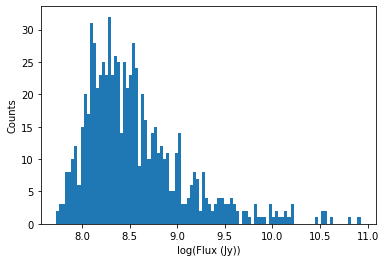
>>> # plots of fluxes are sensible at one frequency since fluxes can change with frequency, plots below provide fluxes
>>> # when frequency = reference frequency (more on this in at_frequencies section)
>>> # log taken since these fluxes have different orders of magnitude
>>> plt.hist(np.log(sm.stokes.value[0,0,index_32768]), bins=20)
>>> plt.xlabel("log(Flux (Jy))")
>>> plt.ylabel("Counts")
>>> plt.show()
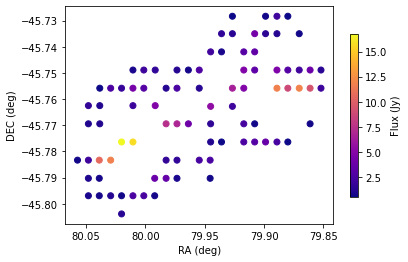
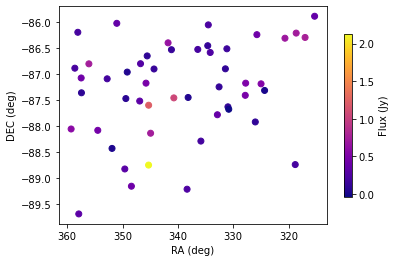
>>> plt.scatter(x=sm.ra[index_32768],y=sm.dec[index_32768],c=sm.stokes[0,0,index_32768],cmap="plasma")
>>> cbar=plt.colorbar(label="Flux (Jy)", orientation="vertical",shrink=.75)
>>> plt.xlim(max(sm.ra.value[index_32768]), min(sm.ra.value[index_32768]))
>>> plt.autoscale()
>>> plt.xlabel("RA (deg)")
>>> plt.ylabel("DEC (deg)")
>>> plt.show()


b) using stokes_error attribute, changing component type
>>> import os
>>> from pyradiosky import SkyModel
>>> from pyradiosky import utils
>>> import matplotlib.pyplot as plt
>>> sm = SkyModel()
>>> filename = os.path.join(DATA_PATH, "gleam_50srcs.vot")
>>> sm.read_gleam_catalog(filename, with_error = True)
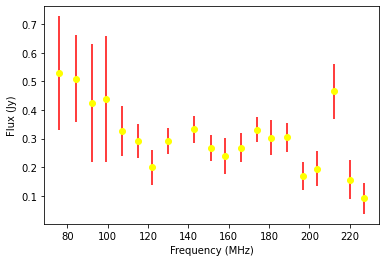
>>> # these are centers of frequency bands
>>> x = sm.freq_array.value/(10**6)
>>> # flux for stokes parameter = 0 (stokes I or unpolarized), Nfreqs index = : (all frequencies),
>>> # Ncomponents index = 0 (first component)
>>> y_error = sm.stokes_error[0,:,0].value
>>> plt.errorbar(x, y, yerr = y_error, fmt="o", ecolor = "red", color="yellow")
>>> plt.xlabel("Frequency (MHz)")
>>> plt.ylabel("Flux (Jy)")
>>> plt.show()
>>> # in_place=True so it’s applied to current object
>>> sm.assign_to_healpix(16, order="nested", inplace=True)
>>> print(sm.nside)
16
>>> print(sm.hpx_order)
nested
c) incorporating astropy healpix package (like plotting pixels), changing component type cont., changing frames
>>> import os
>>> import numpy as np
>>> import math
>>> import matplotlib.pyplot as plt
>>> from matplotlib.patches import Polygon
>>> from pyradiosky import SkyModel
>>> from pyradiosky.data import DATA_PATH
>>> from astropy_healpix import HEALPix
>>> from astropy.coordinates import SkyCoord
>>> sm = SkyModel()
>>> filename = os.path.join(DATA_PATH, "gsm_icrs.skyh5")
>>> sm.read_skyh5(filename)
>>> plt.scatter(sm.ra, sm.dec)
>>> plt.xlim(max(sm.ra.value), min(sm.ra.value))
>>> plt.autoscale()
>>> plt.xlabel("RA (deg)")
>>> plt.ylabel("DEC (deg)")
>>> plt.show()
>>> # a HEALPix map has Ncomponents = 12*nside^2, where components are pixels
>>> print(sm.Ncomponents)
768
>>> print(sm.Nfreqs)
10
>>> print(sm.component_type)
healpix
>>> print(sm.spectral_type)
full
>>> print(sm.freq_array)
[5.00000000e+07 6.11111111e+07 7.22222222e+07 8.33333333e+07
9.44444444e+07 1.05555556e+08 1.16666667e+08 1.27777778e+08
1.38888889e+08 1.50000000e+08] Hz
>>> print(sm.hpx_inds[:10])
[0 1 2 3 4 5 6 7 8 9]
>>> print(sm.hpx_order)
ring
>>> print(sm.nside)
8
>>> print(sm.frame)
icrs
>>> # Use `calc_frame_coherency` to calculate the frame coherency, set store=False to
>>> # return it and not store it.
>>> frame_coherency = sm.calc_frame_coherency(store=False)
>>> print(frame_coherency[:,:,0,0])
[[2352.45649693+0.j 0. +0.j]
[ 0. +0.j 2352.45649693+0.j]] K
>>> plt.hist(np.log(sm.stokes.value[0,0,:]), bins=100)
>>> plt.xlabel("log(Flux (Jy))")
>>> plt.ylabel("Counts")
>>> plt.show()
>>> sm_point = sm.copy()
>>> sm_point.healpix_to_point()
>>> print(sm_point.ra[:3])
[45d00m00s 135d00m00s 225d00m00s]
>>> print(sm_point.dec[:3])
[84d08m59.03857067s 84d08m59.03857067s 84d08m59.03857067s]
>>> print(sm_point.dec[:3].value)
[84.14973294 84.14973294 84.14973294]
>>> sm_point.transform_to("galactic")
>>> sm_point.transform_to("icrs")
>>> # confirms same RA and DEC after transforming point catalog back to icrs frame
>>> print(sm_point.ra[:3])
[45d00m00s 135d00m00s 225d00m00s]
>>> print(sm_point.dec[:3])
[84d08m59.03857067s 84d08m59.03857067s 84d08m59.03857067s]
>>> # used instead of transform_to since this interpolates to new pixel centers, as pixels defined by coordinate system
>>> sm.healpix_interp_transform("galactic")
>>> hp = HEALPix(sm.nside, sm.hpx_order, sm.frame)
>>> print(hp.npix)
768
>>> print(hp.pixel_area)
0.016362461737446838 sr
>>> print(hp.pixel_resolution)
439.74226071262797 arcmin
>>> coord = SkyCoord("00h42m44.3503s +41d16m08.634s", frame="galactic")
>>> print(round(hp.interpolate_bilinear_skycoord(coord, sm.stokes.value[0,0,:])))
6540
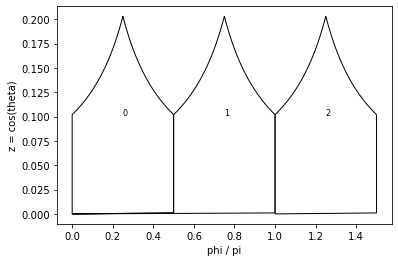
>>> gal_l, gal_b = sm.get_lon_lat()
>>> gal_l_pi = (gal_l.radian/math.pi)[:3]
>>> gal_b_cos = np.cos(gal_b.radian)[:3]
>>> fig, ax = plt.subplots()
>>> ax.scatter(gal_l_pi, gal_b_cos, alpha = 0)
>>> ax.set_xlabel("phi / pi")
>>> ax.set_ylabel("cos(theta)")
>>> for i, txt in enumerate(sm.hpx_inds[:3]):
... #adds pixel index at center of each pixel
... ax.annotate(txt, (gal_l_pi[i], gal_b_cos[i]), fontsize=8)
>>> for hpx_ind in sm.hpx_inds[:3]:
... lon = hp.boundaries_lonlat(hpx_ind, 100)[0]/math.pi
... lat = np.cos(hp.boundaries_lonlat(hpx_ind, 100)[1])
... lon = lon.value
... lat = lat.value
... vertices = np.vstack([lon.ravel(), lat.ravel()]).transpose()
... p = Polygon(vertices, closed=True, edgecolor="black", facecolor="none")
... # adds boundaries around each pixel
... ax.add_patch(p)
>>> gal_l, gal_b = sm.get_lon_lat()
>>> gal_l_pi = (gal_l.radian/math.pi)[:3]
>>> gal_b_cos = np.cos(gal_b.radian)[:3]
>>> fig, ax = plt.subplots()
>>> ax.scatter(gal_l_pi, gal_b_cos, alpha = 0)
>>> ax.set_xlabel("phi / pi")
>>> ax.set_ylabel("cos(theta)")
>>> # nested instead of ring
>>> for ind, txt in enumerate(hp.ring_to_nested(sm.hpx_inds)[:3]):
... ax.annotate(txt, (gal_l_pi[ind], gal_b_cos[ind]), fontsize=8)
>>> for hpx_ind in sm.hpx_inds[:3]:
... lon = hp.boundaries_lonlat(hpx_ind, 100)[0]/math.pi
... lat = np.cos(hp.boundaries_lonlat(hpx_ind, 100)[1])
... lon = lon.value
... lat = lat.value
... vertices = np.vstack([lon.ravel(), lat.ravel()]).transpose()
... p = Polygon(vertices, closed=True, edgecolor="black", facecolor="none")
... ax.add_patch(p)

SkyModel: Creating and writing out catalogs
a) creating and writing out healpix catalog, using get_lon_lat method
>>> import os
>>> import numpy as np
>>> import matplotlib.pyplot as plt
>>> from astropy import units
>>> from pyradiosky import SkyModel

>>> sm = SkyModel(
...   component_type="healpix", nside=1, hpx_inds=[0,1,2,3],
...   stokes=np.zeros((4,1,4)) * units.K,
...   spectral_type="flat", hpx_order="ring", frame="icrs"
... )
>>> print(sm.get_lon_lat())
(<Longitude [ 45., 135., 225., 315.] deg>, <Latitude [41.8103149, 41.8103149, 41.8103149, 41.8103149] deg>)

>>> write_file = os.path.join(".", "zero.skyh5")
>>> sm.write_skyh5(write_file)
b) creating and writing out point catalog, using calculate_rise_set_lsts and clear_time_position_specific_params methods
>>> import os
>>> import numpy as np
>>> from pyradiosky import SkyModel
>>> from pyradiosky.data import DATA_PATH
>>> from astropy import units
>>> from astropy.coordinates import (
...     SkyCoord,
...     EarthLocation,
...     Angle,
...     AltAz,
...     Longitude,
...     Latitude,
...     Galactic)
>>> from astropy.time import Time

>>> array_location = EarthLocation(lat="-30d43m17.5s", lon="21d25m41.9s", height=1073.0)
>>> time = Time("2015-03-01 00:00:00", scale="utc", location=array_location)
>>> source_coord = SkyCoord(
...     alt=Angle(90, unit=units.deg),
...     az=Angle(0, unit=units.deg),
...     obstime=time,
...     frame="altaz",
...     location=array_location)
>>> icrs_coord = source_coord.transform_to("icrs")
>>> # unpolarized only
>>> sm = SkyModel(
...   name="zen_source", skycoord=icrs_coord, stokes=[1.0, 0, 0, 0] * units.Jy,
...   spectral_type="flat", history = "drawn from zenith_skymodel in test_skymodel.py"
... )
>>> print(sm.check(check_extra=True, run_check_acceptability=True))
True

>>> print(sm.name)
['zen_source']
>>> # print(sm.history) to learn where the sky model is drawn from and how it is read/written
>>> sm.update_positions(time, array_location)

>>> sm.calculate_rise_set_lsts(array_location.lat)
>>> print(sm._rise_lst)
[1.16240067]
>>> print(sm._set_lst)
[5.11057854]

>>> # coherency in local alt/az basis can be different from coherency in ra/dec basis
>>> print(sm.coherency_calc()[:,:,0,0])
[[0.5+0.j 0. +0.j]
 [0. +0.j 0.5+0.j]] Jy

>>> print(sm.time)
2015-03-01 00:00:00.000
>>> print(sm.telescope_location)
(5109342.76037543, 2005241.90402741, -3239939.46926403) m
>>> print(sm.alt_az)
[[1.57079633]
 [1.72876609]]
>>> print(sm.pos_lmn)
[[ 2.12981215e-13]
 [-3.39272742e-14]
 [ 1.00000000e+00]]
>>> print(sm.above_horizon)
[ True]
>>> sm.clear_time_position_specific_params()
>>> print(sm.time)
None
>>> print(sm.telescope_location)
None
>>> print(sm.alt_az)
None
>>> print(sm.pos_lmn)
None
>>> print(sm.above_horizon)
None

>>> for param in sm.ncomponent_length_params:
...     print(param)
_above_horizon
_extended_model_group
_hpx_inds
_name
_reference_frequency
_skycoord
_spectral_index
>>> print(sm.Ncomponents)
1

>>> # works for any point component type
>>> write_file = os.path.join(".", "zen_source.txt" )
>>> sm.write_text_catalog(write_file)
SkyModel: Selecting data
a) using cut_nonrising method
>>> import os
>>> import numpy as np
>>> from pyradiosky import SkyModel
>>> from pyradiosky.data import DATA_PATH
>>> from astropy import units
>>> from astropy.coordinates import EarthLocation
>>> from astropy.time import Time, TimeDelta
>>> array_location = EarthLocation(lat="-30d43m17.5s", lon="21d25m41.9s", height=1073.0)
>>> time = Time("2015-03-01 00:00:00", scale="utc", location=array_location)
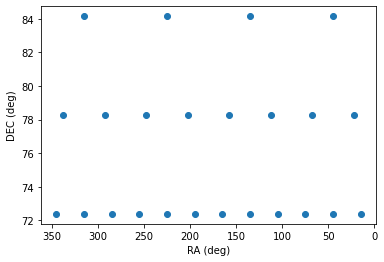
>>> Nras = 20
>>> Ndecs = 20
>>> Nsrcs = Nras * Ndecs
>>> lon = array_location.lon.deg
>>> ra = np.linspace(lon - 90, lon + 90, Nras)
>>> dec = np.linspace(-90, 90, Ndecs)
>>> # to create coordinates for the 400 sources
>>> ra, dec = map(np.ndarray.flatten, np.meshgrid(ra, dec))
>>> print(len(ra))
400
>>> print(len(dec))
400
>>> ra = Longitude(ra, units.deg)
>>> dec = Latitude(dec, units.deg)
>>> names = ["src{}".format(i) for i in range(Nsrcs)]
>>> stokes = np.zeros((4, 1, Nsrcs)) * units.Jy
>>> # stokes I (unpolarized) sources given 1 Jy flux, otherwise no flux
>>> stokes[0, ...] = 1.0 * units.Jy
>>> sm = SkyModel(name=names, ra=ra, dec=dec, frame="icrs", stokes=stokes, spectral_type="flat")
>>> sm2 = sm.cut_nonrising(array_location.lat, inplace=False)
>>> print(sm.Ncomponents)
400
>>> print(sm2.Ncomponents)
320
b) using plotly package and select and select methods
>>> import os
>>> import numpy as np
>>> import matplotlib.pyplot as plt
>>> from pyradiosky import SkyModel
>>> from pyradiosky.data import DATA_PATH
>>> from astropy import units
>>> from astropy.coordinates import (
... SkyCoord,
... EarthLocation,
... Angle,
... AltAz,
... Longitude,
... Latitude,
... Galactic)
>>> import plotly.express as px
>>> sm = SkyModel()
>>> filename = os.path.join(DATA_PATH, "gleam_50srcs.vot")
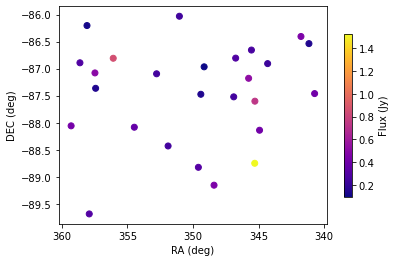
>>> sm.read_gleam_catalog(filename)
>>> sm.jansky_to_kelvin()
>>> plt.scatter(x=sm.ra, y=sm.dec, c=sm.stokes[0,13,:], cmap="plasma")
>>> cbar=plt.colorbar(label="Flux (K)", orientation="vertical",shrink=.75)
>>> plt.xlim(max(sm.ra.value), min(sm.ra.value))
>>> plt.autoscale()
>>> plt.xlabel("RA (deg)")
>>> plt.ylabel("DEC (deg)")
>>> plt.show()
>>> sm.kelvin_to_jansky()
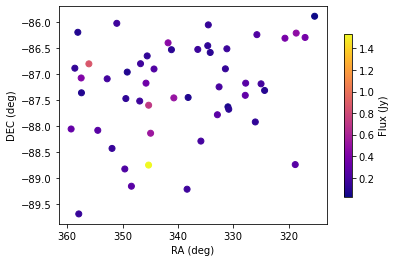
>>> plt.scatter(x=sm.ra, y=sm.dec, c=sm.stokes[0,13,:], cmap="plasma")
>>> cbar=plt.colorbar(label="Flux (Jy)", orientation="vertical",shrink=.75)
>>> plt.xlim(max(sm.ra.value), min(sm.ra.value))
>>> plt.autoscale()
>>> plt.xlabel("RA (deg)")
>>> plt.ylabel("DEC (deg)")
>>> plt.show()
>>> plt.hist(np.log(sm.stokes.value[0,13,:]), bins=10)
>>> plt.xlabel("log(Flux (Jy))")
>>> plt.ylabel("Counts")
>>> plt.show()
>>> print(sm.freq_array)
[7.60e+07 8.40e+07 9.20e+07 9.90e+07 1.07e+08 1.15e+08 1.22e+08 1.30e+08
1.43e+08 1.51e+08 1.58e+08 1.66e+08 1.74e+08 1.81e+08 1.89e+08 1.97e+08
2.04e+08 2.12e+08 2.20e+08 2.27e+08] Hz
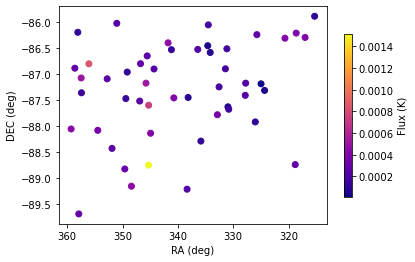
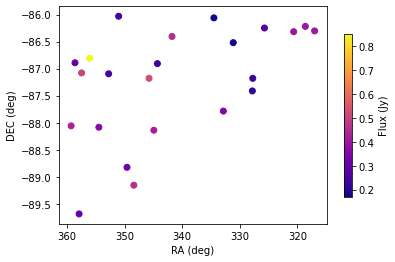
>>> sm2 = sm.copy()
>>> sm2.select(lon_range = Longitude([340, 360], units.deg))
>>> plt.scatter(x=sm2.ra, y=sm2.dec, c=sm2.stokes[0,13,:], cmap="plasma")
>>> cbar=plt.colorbar(label="Flux (Jy)", orientation="vertical",shrink=.75)
>>> plt.xlim(max(sm.ra.value), min(sm.ra.value))
>>> plt.autoscale()
>>> plt.xlabel("RA (deg)")
>>> plt.ylabel("DEC (deg)")
>>> plt.show()
>>> sm3 = sm.copy()
>>> sm3.select(min_brightness=.1*units.Jy, max_brightness=1*units.Jy, brightness_freq_range=[100*10**6,
... 200*10**6]*units.Hz)
>>> plt.scatter(x=sm3.ra, y=sm3.dec, c=sm3.stokes[0,13,:], cmap="plasma")
>>> cbar=plt.colorbar(label="Flux (Jy)", orientation="vertical",shrink=.75)
>>> plt.xlim(max(sm.ra.value), min(sm.ra.value))
>>> plt.autoscale()
>>> plt.xlabel("RA (deg)")
>>> plt.ylabel("DEC (deg)")
>>> plt.show()
>>> plt.hist(np.log(sm3.stokes.value[0,13,:]), bins=10)
>>> plt.xlabel("log(Flux (Jy))")
>>> plt.ylabel("Counts")
>>> plt.show()
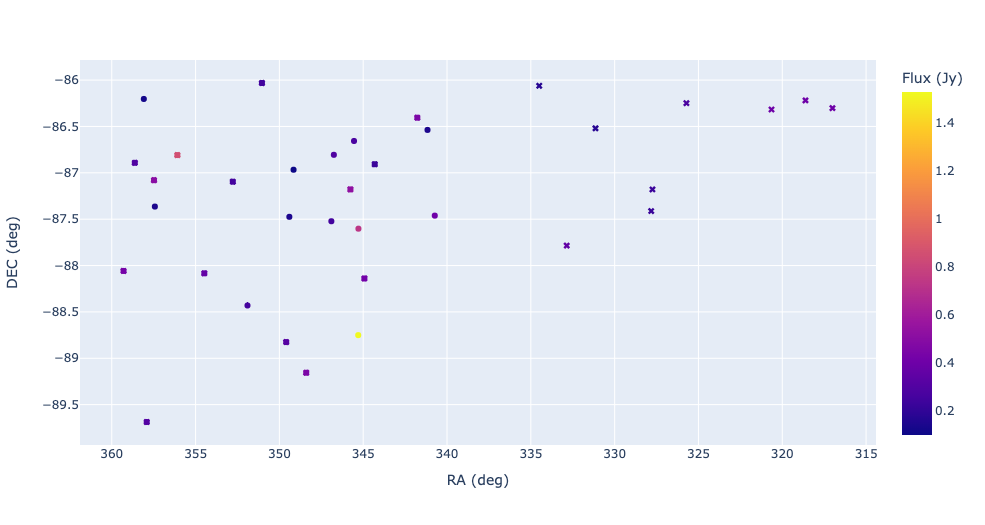
>>> fig = px.scatter(x=sm2.ra.value, y=sm2.dec.value, color=sm2.stokes[0,13,:].value,
... labels={"x": "RA (deg)", "y": "DEC (deg)", "color": "Flux (Jy)"})
>>> fig.add_trace(px.scatter(x=sm3.ra.value, y=sm3.dec.value, symbol_sequence=["x"],
... color=sm3.stokes[0,13,:].value, labels={"x": "RA (deg)", "y": "DEC (deg)",
... "color": "Flux (Jy)"}).data[0])
>>> # for RA to be in conventional order
>>> fig.update_layout(xaxis_range=[max(sm3.ra.value),min(sm3.ra.value)])
>>> # like autoscale
>>> fig["layout"]["xaxis"].update(autorange = True)
>>> fig.show()
>>> sm4 = sm.select(
... min_brightness=0.2 * units.Jy, max_brightness=1.5 * units.Jy, inplace=False
... )
>>> print(sm.Ncomponents)
50
>>> print(sm4.Ncomponents)
9


c) using select method, incorporating astropy healpix package
>>> import os
>>> import numpy as np
>>> import math
>>> import matplotlib.pyplot as plt
>>> from pyradiosky import SkyModel
>>> from pyradiosky.data import DATA_PATH
>>> from astropy import units as u
>>> from astropy_healpix import HEALPix
>>> sm = SkyModel()
>>> filename = os.path.join(DATA_PATH, "gsm_icrs.skyh5")
>>> sm.read_skyh5(filename)
>>> plt.scatter(sm.ra, sm.dec)
>>> plt.xlim(max(sm.ra.value), min(sm.ra.value))
>>> plt.autoscale()
>>> plt.xlabel("RA (deg)")
>>> plt.ylabel("DEC (deg)")
>>> plt.show()
>>> sm_new = sm.copy()
>>> inds = list(range(0, 24))
>>> sm_new.select(component_inds=inds)
>>> plt.scatter(sm_new.ra, sm_new.dec)
>>> plt.xlim(max(sm.ra.value), min(sm.ra.value))
>>> plt.autoscale()
>>> plt.xlabel("RA (deg)")
>>> plt.ylabel("DEC (deg)")
>>> plt.show()
>>> write_file = os.path.join(".", "gsm_icrs_new.skyh5" )
>>> sm_new.write_skyh5(write_file)
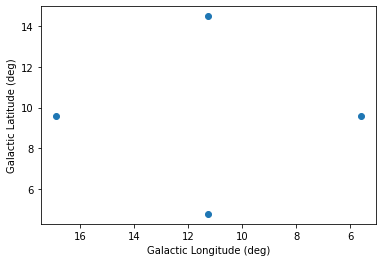
>>> # used instead of transform_to since this interpolates to new pixel centers, as pixels defined by coordinate system
>>> sm.healpix_interp_transform("galactic")
>>> hp = HEALPix(sm.nside, sm.hpx_order, sm.frame)
>>> cone_index = hp.cone_search_lonlat(10 * u.deg, 10 * u.deg, radius=5 * u.deg)
>>> print(cone_index)
[304 273 337 305]
>>> lon, lat = sm.get_lon_lat()
>>> plt.scatter(lon.value[cone_index], lat.value[cone_index])
>>> plt.xlim(max(lon.value[cone_index]), min(lon.value[cone_index]))
>>> plt.autoscale()
>>> plt.xlabel("Galactic Longitude (deg)")
>>> plt.ylabel("Galactic Latitude (deg)")
>>> plt.show()
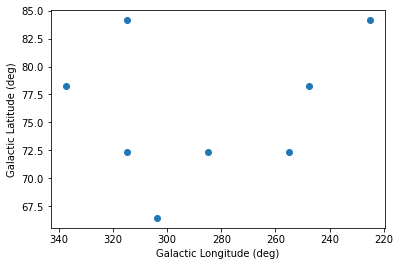
>>> neighbours_10 = hp.neighbours(10)
>>> print(neighbours_10)
[21 20 9 2 3 11 22 37]
>>> plt.scatter(lon.value[neighbours_10], lat.value[neighbours_10])
>>> plt.xlim(max(lon.value[neighbours_10]), min(lon.value[neighbours_10]))
>>> plt.autoscale()
>>> plt.xlabel("Galactic Longitude (deg)")
>>> plt.ylabel("Galactic Latitude (deg)")
>>> plt.show()
SkyModel: Concatenating data
a) using select and concat methods
>>> import os
>>> import numpy as np
>>> import matplotlib.pyplot as plt
>>> from pyradiosky import SkyModel
>>> from pyradiosky.data import DATA_PATH
>>> from astropy import units
>>> from astropy.coordinates import (
... SkyCoord,
... EarthLocation,
... Angle,
... AltAz,
... Longitude,
... Latitude,
... Galactic)
>>> sm = SkyModel()
>>> filename = os.path.join(DATA_PATH, "pointsource_catalog.txt")
>>> sm.read_text_catalog(filename)
>>> plt.scatter(x=sm.ra, y=sm.dec, c=sm.stokes[0,0,:], cmap="plasma")
>>> cbar=plt.colorbar(label="Flux (Jy)", orientation="vertical",shrink=.75)
>>> plt.xlim(max(sm.ra.value), min(sm.ra.value))
>>> plt.autoscale()
>>> plt.xlabel("RA (deg)")
>>> plt.ylabel("DEC (deg)")
>>> plt.show()
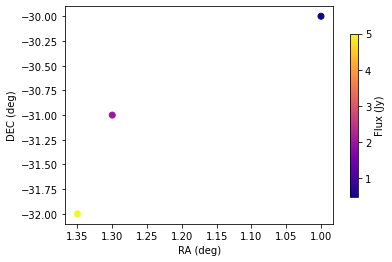
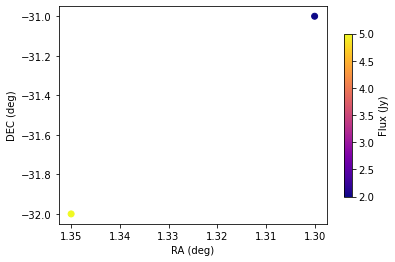
>>> sm2 = sm.copy()
>>> sm2.select(lon_range = Longitude([1.26, 1.31], units.deg))
>>> sm3 = sm.copy()
>>> sm3.select(lon_range = Longitude([1.31, 1.36], units.deg))
>>> sm_new = sm2.concat(sm3, inplace=False)
>>> write_file = os.path.join(".", "2srcs.txt" )
>>> sm_new.write_text_catalog(write_file)
>>> plt.scatter(x=sm_new.ra, y=sm_new.dec, c=sm_new.stokes[0,0,:], cmap="plasma")
>>> cbar=plt.colorbar(label="Flux (Jy)", orientation="vertical",shrink=.75)
>>> plt.xlim(max(sm_new.ra.value), min(sm_new.ra.value))
>>> plt.autoscale()
>>> plt.xlabel("RA (deg)")
>>> plt.ylabel("DEC (deg)")
>>> plt.show()
SkyModel: using at_frequencies method
a) subband spectral type
>>> import os
>>> from pyradiosky import SkyModel
>>> from pyradiosky.data import DATA_PATH
>>> from astropy import units
>>> import matplotlib.pyplot as plt
>>> sm = SkyModel()

>>> filename = os.path.join(DATA_PATH, "gleam_50srcs.vot")
>>> sm.read_gleam_catalog(filename)

>>> print(sm.freq_array)
[7.60e+07 8.40e+07 9.20e+07 9.90e+07 1.07e+08 1.15e+08 1.22e+08 1.30e+08
 1.43e+08 1.51e+08 1.58e+08 1.66e+08 1.74e+08 1.81e+08 1.89e+08 1.97e+08
 2.04e+08 2.12e+08 2.20e+08 2.27e+08] Hz

>>> plt.scatter(x=sm.ra, y=sm.dec, c=sm.stokes[0,4,:], cmap="plasma")
>>> cbar=plt.colorbar(label="Flux (Jy)", orientation="vertical",shrink=.75)
>>> plt.xlim(max(sm.ra.value), min(sm.ra.value))
>>> plt.autoscale()
>>> plt.xlabel("RA (deg)")
>>> plt.ylabel("DEC (deg)")
>>> plt.show()

>>> sm.at_frequencies(freqs=[200*10**6]*units.Hz, inplace=True, freq_interp_kind="cubic", nan_handling="clip",
...                   run_check=True, atol=None)

>>> print(sm.freq_array)
[2.e+08] Hz

>>> plt.scatter(x=sm.ra, y=sm.dec, c=sm.stokes[0,0,:], cmap="plasma")
>>> cbar=plt.colorbar(label="Flux (Jy)", orientation="vertical",shrink=.75)
>>> plt.xlim(max(sm.ra.value), min(sm.ra.value))
>>> plt.autoscale()
>>> plt.xlabel("RA (deg)")
>>> plt.ylabel("DEC (deg)")
>>> plt.show()
b) spectral index spectral type
>>> import os
>>> import numpy as np
>>> import matplotlib.pyplot as plt
>>> from pyradiosky import SkyModel
>>> from pyradiosky.data import DATA_PATH
>>> sm = SkyModel()
>>> filename = os.path.join(DATA_PATH, "fhd_catalog.sav")
>>> sm.read_fhd_catalog(filename)
>>> # correction done since catalog reference frequencies had wrong power
>>> sm.reference_frequency = sm.reference_frequency*10**6
>>> print(np.unique(sm.reference_frequency))
[7.40000000e+07 1.80000000e+08 1.81000000e+08 2.15675003e+08] Hz
>>> print(sm.stokes.value[0,0,8235])
0.5017849802970886
>>> print(sm.reference_frequency[8235])
215675003.0517578 Hz
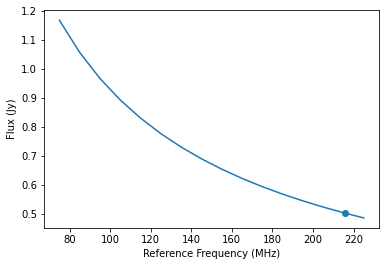
>>> # last component (at index 8325) was chosen due to nonzero spectral index
>>> print(sm.spectral_index[8235])
-0.8
>>> x = np.linspace(75*10**6, 225*10**6, 16)
>>> # y = sm.stokes.value[0,0,8235] (flux is accurate for a frequency x) when x = sm.reference_frequency[8235]
>>> y = sm.stokes.value[0,0,8235]*(x/sm.reference_frequency[8235])**sm.spectral_index[8235]
>>> plt.plot(x/10**6,y)
>>> plt.scatter(sm.reference_frequency[8235]/10**6, sm.stokes.value[0,0,8235])
>>> plt.xlabel("Reference Frequency (MHz)")
>>> plt.ylabel("Flux (Jy)")
>>> # this plot illustrates how flux changes with frequency
>>> plt.show()
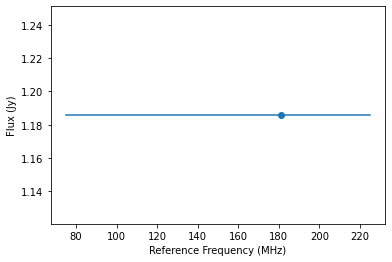
>>> print(sm.stokes.value[0,0,0])
1.185837984085083
>>> print(sm.reference_frequency[0])
181000000.0 Hz
>>> print(sm.spectral_index[0])
0.0
>>> x = np.linspace(75*10**6, 225*10**6, 16)
>>> y = sm.stokes.value[0,0,0]*(x/sm.reference_frequency[0]/10**6)**sm.spectral_index[0]
>>> plt.plot(x/10**6,y)
>>> plt.scatter(sm.reference_frequency[0]/10**6, sm.stokes.value[0,0,0])
>>> plt.xlabel("Reference Frequency (MHz)")
>>> plt.ylabel("Flux (Jy)")
>>> # if spectral index is 0, the spectrum is flat meaning same flux for all frequencies, that's why the
>>> # at_frequencies method for the flat spectral type just copies
>>> plt.show()
>>> sm.at_frequencies(freqs=[200*10**6]*units.Hz, inplace=True, run_check=True, atol=None)
>>> print(f"{sm.stokes[0,0,8235]:.4f}")
0.5330 Jy
c) full spectral type
>>> import os
>>> import numpy as np
>>> import matplotlib.pyplot as plt
>>> from pyradiosky import SkyModel
>>> from pyradiosky.data import DATA_PATH
>>> sm = SkyModel()

>>> filename = os.path.join(DATA_PATH, "gsm_icrs.skyh5")
>>> sm.read_skyh5(filename)

>>> print(sm.freq_array)
[5.00000000e+07 6.11111111e+07 7.22222222e+07 8.33333333e+07
 9.44444444e+07 1.05555556e+08 1.16666667e+08 1.27777778e+08
 1.38888889e+08 1.50000000e+08] Hz

>>> plt.hist(np.log(sm.stokes.value[0,9,:]), bins=100)
>>> plt.xlabel("log(Flux (Jy))")
>>> plt.ylabel("Counts")
>>> plt.show()

>>> sm.at_frequencies(freqs=[150*10**6]*units.Hz, inplace=True, run_check=True, atol=None)
>>> print(sm.freq_array)
[1.5e+08] Hz

>>> plt.hist(np.log(sm.stokes.value[0,0,:]), bins=100)
>>> plt.xlabel("log(Flux (Jy))")
>>> plt.ylabel("Counts")
>>> plt.show()